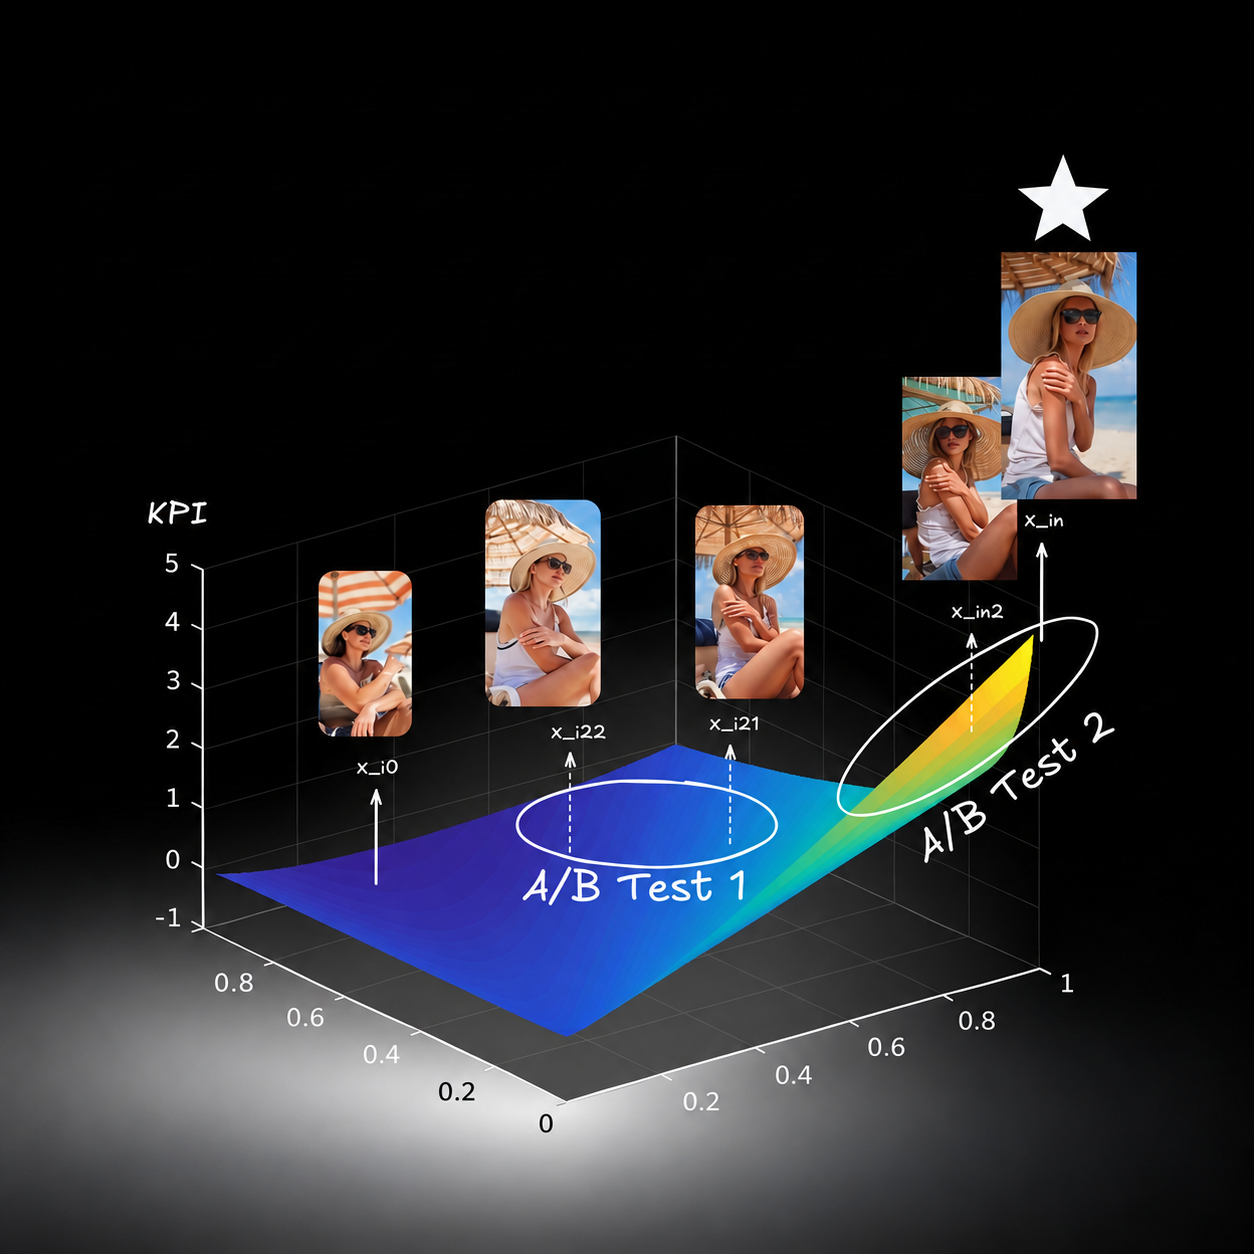
A promotional email campaign for a consumer brand tested 2 creative concepts side by side across hundreds of thousands of recipients:
• "Seasonal Sale: $15 Off $50+"
• "We Almost Never Do This (Here You Go)"
Most marketers would bet on the $15 discount. Instead, the second line beat the first by 58% in click-through rate (0.57% vs. 0.36%, almost a 60% difference). Yet before anyone designed or sent a single email, our proprietary ranking model trained on that brand's past campaigns predicted the exact opposite of the rulebook—and got it right.
At Eikona, we build software that generates and optimizes marketing content for B2C organizations. For every campaign, our creative-concept agent generates 50+ candidate creative concepts, each built around a distinct intent and core message for the send. Then our agentic Studio turns a shortlist of those concepts into finished emails from scratch. An online decisioning algorithm, trained on past brand engagement data, then sends them in a dynamic campaign and allocates traffic toward the winning variations as engagement arrives.
In a world where generation is a commodity, the hard question is what to generate. While off-the-shelf LLMs can brainstorm ideas, they cannot predict which of those ideas will actually perform better, even when they claim they can. Generic copywriting rules are no better than a coin flip, as we show below. Nor can you simply test every idea in production: each variation needs enough traffic to separate clicks from random counting noise, so even the largest mailing lists can test only a handful at once. You need a model that filters dozens of candidate concepts down to the shortlist worth building and testing.
For that task, we built a per-brand Bayesian learning-to-rank model that maps concept embeddings to posterior distributions over performance scores before design starts. On our anchor brand (Brand A), for example, the model ordered held-out variation pairs right 66.1% of the time [62.2%, 69.8%], where 50% is a coin flip. That is a strong edge on noisy click data: Meta's AdLlama team drove a 6.7% live CTR lift on Facebook ads from a reward model with 57% pairwise accuracy. We recently deployed models for multiple brands to production, ordering live variation pairs right 63.6% of the time across 48 live dynamic campaigns [56.9%, 69.8%].
Getting to a system that worked meant throwing out two things we expected to succeed: Spearman rank correlation as our evaluation metric and 23 expert-crafted rules of "good copy."
Why a noisy pre-filter works when paired with an online decisioning algorithm
A natural objection is that predicting click rates from a creative concept before the email is even designed is too noisy to trust. If the ranker picked a single winner and sent it to the whole list, that objection would be right.
In our pipeline, the ranker and the online decisioning algorithm do different jobs:

The ranker chooses which concepts enter the dynamic campaign; the online decisioning algorithm chooses the winner among the concepts tested.
Because the ranker only trims a large batch of candidate concepts down to a shortlist of 10, it does not need to find the single best email. It only needs to keep most of the weak ideas out of the shortlist so the online decisioning algorithm can spend its exploration traffic on stronger candidates.
Before training any model, we ran a simulation of a typical dynamic campaign (filtering 30 candidate concepts down to a shortlist of 10) to see how much value a noisy ranker preserves. We varied the correlation ρ between the ranker's score and true creative quality from ρ = 0 (guessing) to ρ = 1 (a perfect oracle). In each simulated send, the decisioning algorithm explored the kept 10 on the first 25% of the audience and promoted the leader to the remaining 75%.
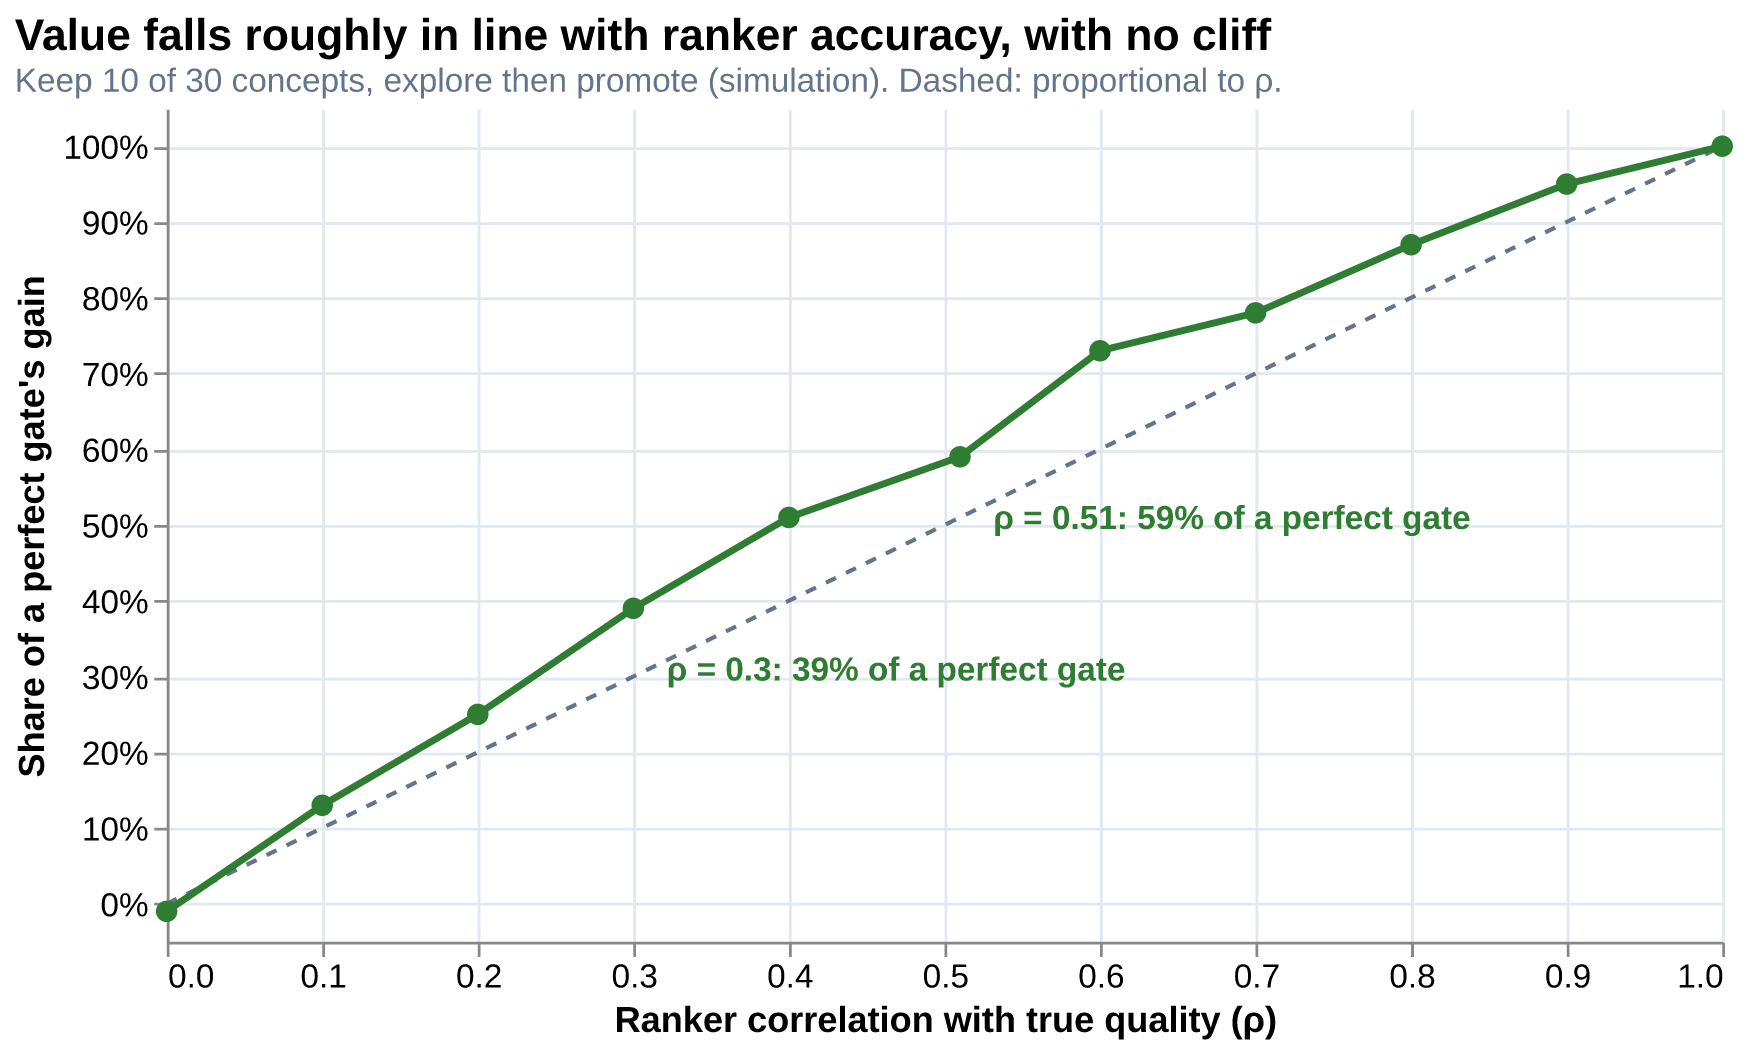
Figure 1 shows why the math is forgiving. There is no cliff where an imperfect model suddenly becomes useless. A ranker with a modest correlation of ρ = 0.30 still captures 39% of the click gain of a perfect oracle; at ρ = 0.51, it captures 59%. Meta's AdLlama team saw a similar result when training an LLM to write Facebook ad text. Their reward model had just 57% out-of-sample pairwise accuracy, yet it drove a 6.7% relative click lift in a 10-week live test (arXiv:2507.21983).
Why raw click rates fail: campaign identity explains 81% of the variance
If you train a model to predict raw click-through rates across past campaigns, you do not get a concept ranker. You get a calendar and audience detector.
In Brand A's history, one promotional email ("An Exclusive Offer With Your Name On It") got a 1.15% click rate. Two months later, a routine product email ("Your everyday comfort essential") got 0.073%, a 16-fold difference. Yet the 1.15% email lost its own A/B test, while the 0.073% email won its test. Across our dataset, which campaign an email belonged to explains 81% of the variance in raw click rates. Holiday timing, list segments, and promotion depth swamp the effect of the creative itself.
To isolate the creative concept, we never compare click rates across different sends. We only compare competing variations (called arms) that went out side by side in the same campaign.
Even inside a single campaign, raw click rates have a second problem: sample sizes are wildly unequal. Because our online decisioning algorithm shifts traffic away from losing arms early, a winning arm might reach hundreds of thousands of recipients while a weak arm stops after a few thousand. A 0.40% click rate across hundreds of thousands of recipients is rock solid; a 0.40% click rate on a few thousand recipients is a handful of clicks and mostly luck.
We solve both problems in one step. For each arm a with ca clickers out of na recipients, we place a Beta(½, ½) prior on its click probability and map its posterior to the log-odds scale. We then subtract the campaign average μ̄e and keep the arm's exact counting error bar σa:
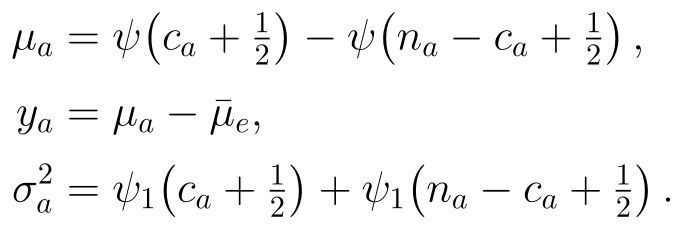
Here ψ and ψ1 are standard functions (digamma and trigamma) that give the exact mean and variance of a Beta distribution on the log-odds scale.
In plain terms, every variation gets two numbers:
• A relative score ya measuring how much better or worse it performed than its siblings in the same send (so the arms of every campaign average to zero).
• An error bar σa measuring how noisy that score is (small when clicks are plentiful, wide when clicks are scarce).
In our opening two-variation send, the winning concept (0.57% CTR, receiving 91% of the traffic) gets a label of y = +0.192 ± 0.018, while the losing concept (0.36% CTR, receiving 9% of the traffic) gets y = -0.268 ± 0.069. Across Brand A's controlled creative tests, 82% of the variance in ya is genuine creative signal above random click-counting noise.
Trap #1: Why Spearman correlation broke on small A/B tests
Once we had clean labels, we needed a metric to grade the ranker. Before fitting any models, we pre-registered the textbook choice: within each held-out campaign, rank the variations by model score and by actual clicks, compute Spearman's rank correlation, and take the median across campaigns. We set two bars in advance: a median correlation of 0.30 to let the model filter concepts automatically (the gate bar), and 0.15 to show scores as human guidance (the advise bar).
On Brand A, our concept-embedding model scored a median Spearman correlation of 0.400 [0.300, 0.457] across held-out campaigns. By our own rule, it passed. Then we inspected the individual campaigns and discovered that Spearman was broken for small A/B tests in three ways:
1. A near-tie costs as much as a major mistake. Most of our campaigns test about 4 variations. With 4 items, Spearman correlation can take only 11 possible values, spaced 0.20 apart (-1.0, -0.8, …, +0.8, +1.0). In one January campaign, the model got #1 and #4 right, but swapped #2 and #3: two variations whose actual click rates were 0.30% and 0.28%, a virtual tie within click noise. Swapping that tie penalized the campaign's Spearman score by 0.20, wider than our entire 0.15 decision band between the advise bar (0.15) and the gate bar (0.30).
2. It throws away 38% of our data. Because rank correlation on 2 or 3 items is too coarse to use, our Spearman rule required at least 4 variations per campaign. That requirement silently discarded almost 40% of our historical campaigns across brands, including the two-variation send we opened with.
3. It is too noisy to compare two models. To compare models fairly, we resample whole campaigns 4,000 times and score both models on the exact same resample. Even then, when we compared our Bayesian embedding model against a simpler ridge regression on the same campaigns, the median Spearman difference was +0.086 [-0.083, +0.157]—separating the models in only 63% of bootstrap resamples.
To fix the metric itself, we replaced Spearman with confidence-weighted pairwise accuracy (WPA). Instead of grading a whole campaign on a coarse rank lattice, we look at every pair of variations (a, b) inside the same campaign and ask: did the ranker put this pair in the right click order?

Here rab is 1 if the ranker got the pair right, 0 if wrong, and ½ on a tie. The weight wab uses the standard Normal CDF Φ to measure how certain the click data is about which variation actually won:
• When one variation clearly beat the other (like our opening send, 0.57% vs. 0.36%), wab ≈ 1 and the pair counts at full weight.
• When two variations virtually tied within click noise (like the January send, 0.30% vs. 0.28%), wab ≈ 0 and the pair barely counts.
A coin flip scores 0.50; a perfect ranker scores 1.00. Because every campaign with at least 2 variations has pairs, WPA recovers all of those discarded 2- and 3-variation campaigns. And on the exact same Brand A comparison where Spearman could not separate the models (63% of resamples), WPA resolved the Bayesian model's lead over ridge regression in 97% of resamples (+0.030 [-0.002, +0.063]).

Switching metrics only helps if the bar stays honest. We simulated rankers of known true quality ρ* on our brands' actual send profiles and read both metrics at every step (Figure 2, right). The old 0.30 Spearman gate bar maps to 0.62 on the WPA scale (and 0.15 maps to 0.56), agreeing within 0.005 across two distinct brand profiles.
What we built, and how it performed on past sends
With the label and metric in place, the model itself is simple. Each brand gets its own heteroscedastic Bayesian linear model on concept embeddings:
• Concept embeddings: A frozen embedding model turns each creative concept into a dense vector, which we compress to its top 40 principal components (refit inside each training fold so test data never leaks).
• Within-campaign regression: A linear weight vector β predicts each variation's relative concept score, centered within its campaign to match our centered click labels.
• Weighting by click certainty (heteroscedastic): Standard ridge regression treats a noisy low-traffic arm and a high-traffic arm with hundreds of thousands of recipients as equally informative. Our likelihood weights each arm by its known click-noise variance σa2 plus a learned creative remainder σε2, so high-traffic arms anchor the fit.
• Bayesian posterior draws: PyMC learns a shrinkage scale τ that regularizes the weights and saves 4,000 plausible weight vectors β(s). Scoring a new batch of concepts is a single matrix multiply over those saved draws, returning both a predicted score and an uncertainty bar for every concept.
We tested the model with 10-fold cross-validation grouped by campaign: all variations of a campaign stay in the same fold, so the model never sees any part of a campaign it evaluates.
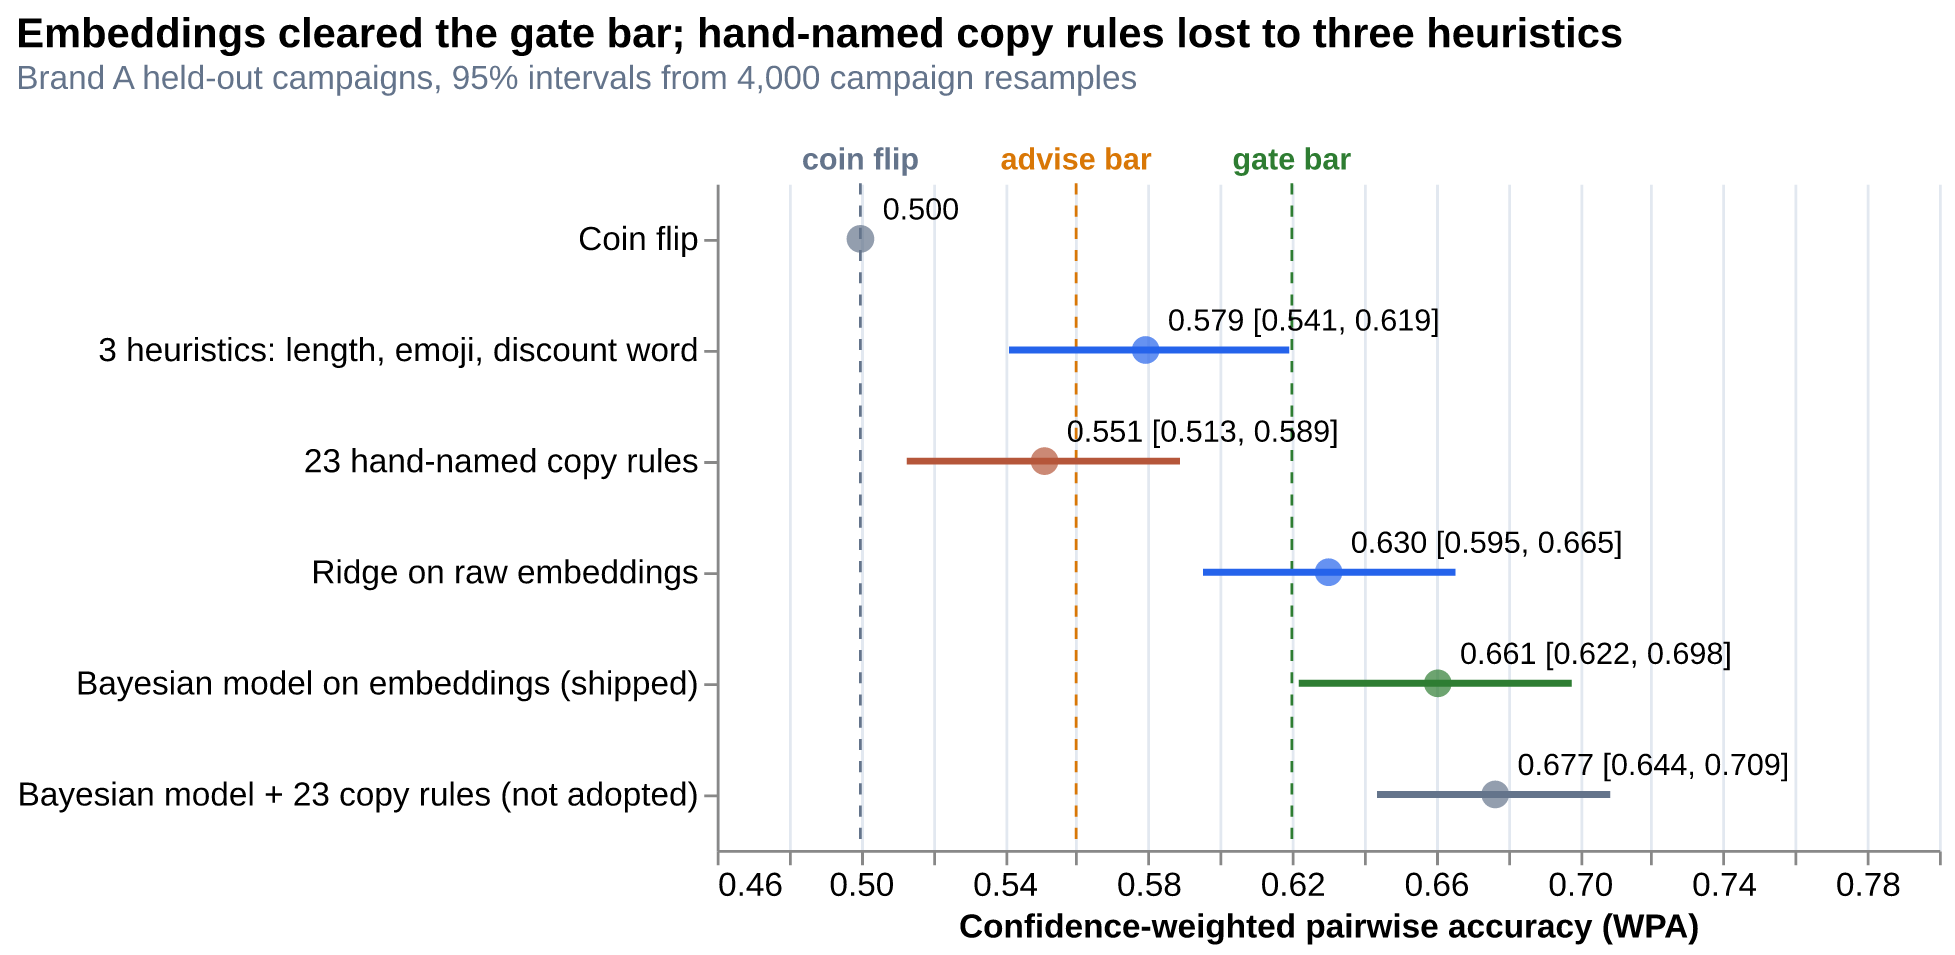
Each step on the Brand A ladder earned its keep (Figure 3). Three simple heuristics (0.579) cleared the 0.56 advise bar, whereas adding 20 copy rules created with the advisory of marketing creative and copy experts dragged accuracy down to 0.551. Moving to concept embeddings with equal-weight ridge regression crossed the 0.62 gate bar at 0.630. Weighting each variation by its click certainty in the shipped Bayesian model reached 0.661 [0.622, 0.698], clearing the gate bar even at the bottom of its 95% interval. On campaigns whose concepts never appeared in any other fold, accuracy held at 0.653, ruling out memorization.
To translate that accuracy into click lift, we replayed a pre-design filter on historical Brand A campaigns that tested at least five variations. Keeping the top half by out-of-fold score captured 40% [29.8%, 51.4%] of the gain of a hindsight oracle (+0.009 click-rate points on a 0.251% base rate, a 3.7% relative lift). Across our other brands, offline cross-validation landed between 0.568 and 0.603.
Trap #2: We tested 23 rules of "good copy," and 21 were noise
Marketing folklore is full of copywriting rules: urgency drives action, scarcity creates fear of missing out, questions hook the reader, emojis stand out in the inbox, discount numbers win clicks.
To test whether explicit copy rules could beat concept embeddings, we consulted with industry copywriting experts and built pattern detectors for 23 copy attributes across four categories. These covered form (length, emojis, questions, ALL CAPS), offers (discounts, percentage off, dollar amounts, "free"), pressure (urgency, scarcity), and framing ("you", command openers like "Shop" or "Grab", social proof, newness).
Trained on the exact same Brand A campaigns, the 23 attributes scored 0.551 [0.513, 0.589], losing to the 3 simple heuristics they contained (0.579, Figure 3) because the 20 extra features mostly added noise. Combining all 23 attributes with the concept embeddings did not reliably improve prediction either (+0.016 [-0.016, +0.050], ahead in 83% of resamples against our 97.5% bar).
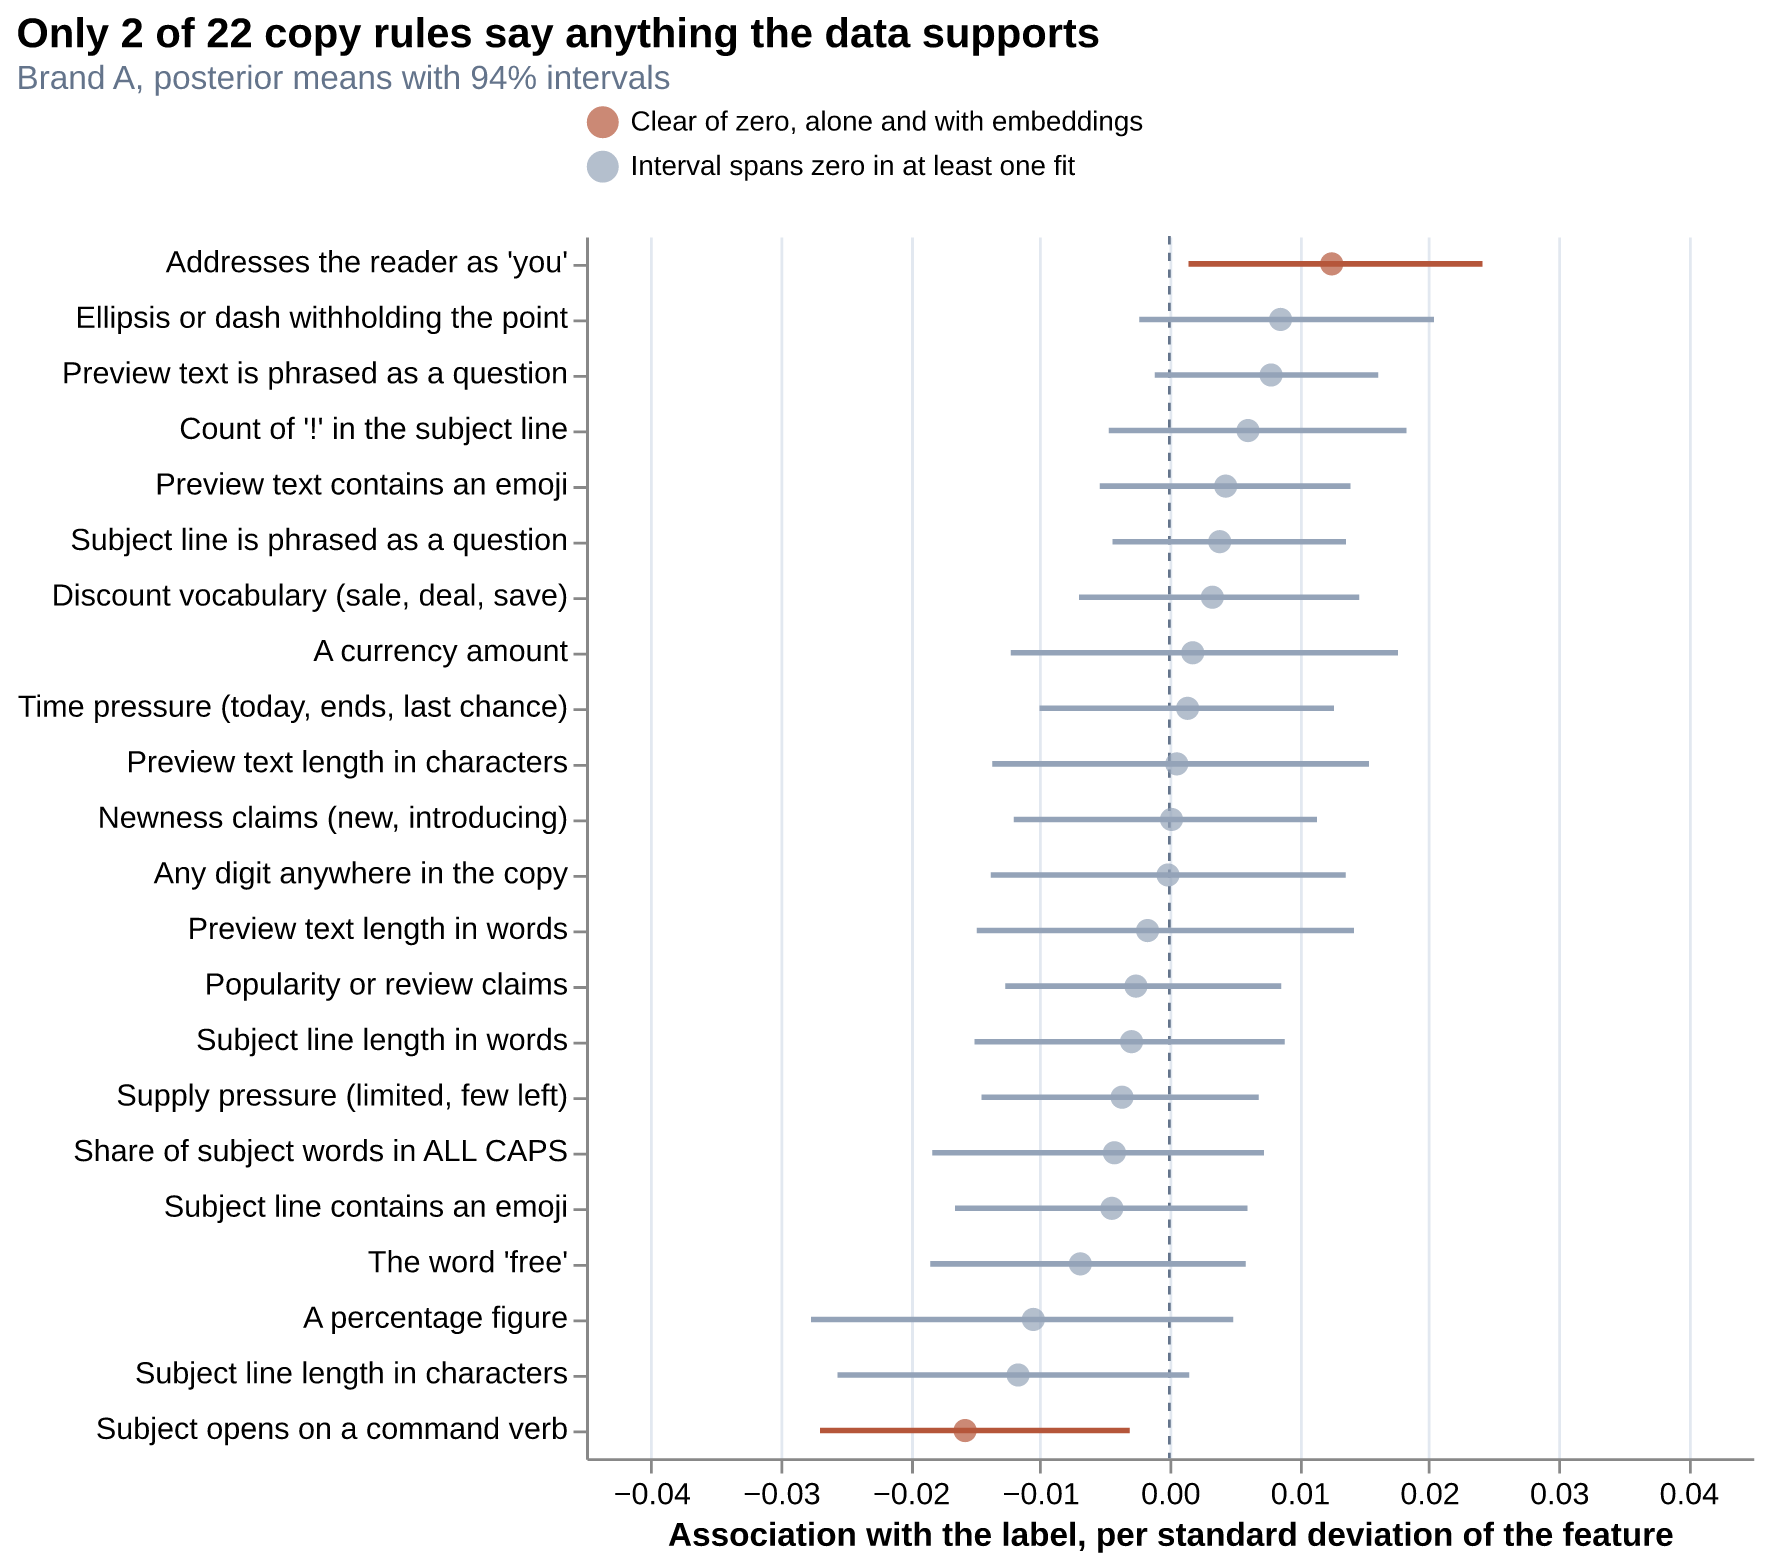
When we checked which individual rules held up both alone and alongside the embeddings, only 2 of 22 survived (Figure 4). Addressing the reader as "you" went with about 2.6% more clicks [0.3%, 5.0%], while opening with a command verb ("Shop", "Grab") went with fewer clicks. Urgency, scarcity, discounts, emojis, and questions were indistinguishable from zero.
Worse, when we ran those 23 rules on a real batch of 40 concepts generated by our creative-concept agent, 11 of the 23 rules had zero variance across the batch. Because the campaign brief carried no discount and the prompt forbids inventing offers, 0% of the 40 generated concepts mentioned a discount (versus 24% of historical emails). A feature that takes the same value on every candidate cannot rank them.
That 40-concept batch revealed a deeper property of LLM generation. Asking an LLM for 40 concepts does not give you 40 independent ideas: many candidates were the same promise in different words. For example, "Try it for 30 days before you decide" and "A full month to fall for it (or send it back)" had a 0.88 correlation across our model's posterior draws. To count distinct ideas, we take the eigenvalues λi of the 40 × 40 posterior correlation matrix and compute the participation ratio:
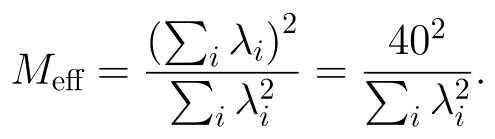
Here 40 unrelated ideas would give Meff = 40, and one idea repeated 40 times would give 1. Our batch gave 1600 / 138.5 = 11.6: forty generated concepts held about twelve real choices.
In production: what 48 live dynamic campaigns show
We recently deployed the frozen per-brand models for multiple active brands to a serverless inference service on Modal. Whenever our creative-concept agent generates concepts for a dynamic campaign, the ranker scores the entire batch in under half a second and orders the candidates before design begins.
As each dynamic campaign finishes sending to live audiences, we grade the ranker's pre-send predictions directly against the realized click outcomes across all sent variations. Across all 48 live dynamic campaigns, the ranker ordered sent variation pairs correctly 63.6% of the time [56.9%, 69.8%], with the entire 95% interval clear of the 50% coin-flip line.
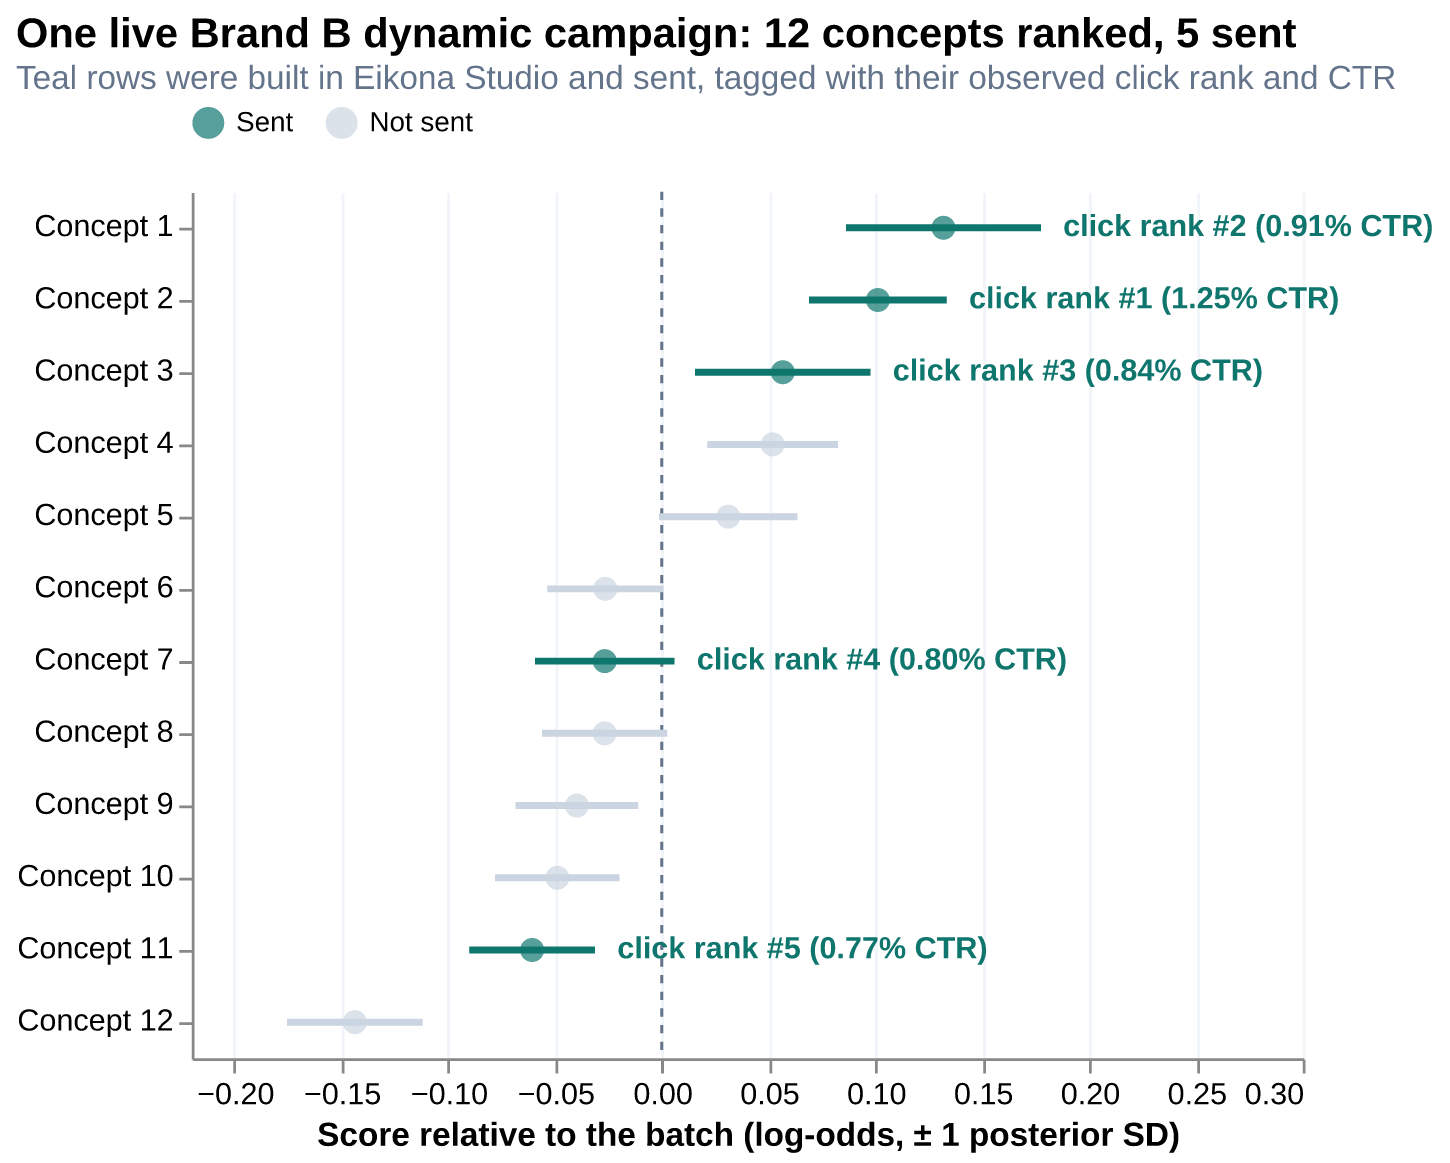
Figure 5 shows what one live batch looks like in full. For a Brand B loyalty campaign, our creative-concept agent generated 12 creative concepts and the ranker ordered them from +0.132 down to -0.144 in log-odds. Eikona Studio built and sent 5 variations in the live dynamic campaign (teal rows). The ranker's top three sent concepts (Concepts 1, 2, and 3) finished #2, #1, and #3 in realized clicks (0.91%, 1.25%, and 0.84% CTR). Meanwhile, the two lower-scored concepts (Concepts 7 and 11 in the batch) finished #4 and #5 (0.80% and 0.77% CTR), giving a within-send WPA of 0.85 and a rank correlation of 0.90.
Embeddings for the shortlist, online decisioning for the winner
Look back at the two concepts we opened with: "Seasonal Sale: $15 Off $50+" and "We Almost Never Do This (Here You Go)". A human copywriter looking for a rule might guess that curiosity beats a discount, or that parentheses help. When we tested 23 explicit rules like that across held-out campaigns, 21 of them were indistinguishable from noise. Yet a frozen embedding model paired with a brand-specific Bayesian linear model called the winner—not by following a copywriting rulebook, but by learning which regions of embedding space that brand's audience actually clicks.
That is the core lesson of this system. Any off-the-shelf language model can generate dozens of concepts on command, but only a model trained on a brand's own send history can predict which ones its audience will click. Pre-send scoring will never capture everything that happens in a live inbox, which is why the ranker never replaces the live dynamic campaign. Its job is simpler: trim a large batch of candidate concepts down to the shortlist worth building in Eikona Studio, and let our online decisioning algorithm find the winner on real traffic.
Eikona builds the Adaptive Marketing Engine, generating and optimizing marketing content with online decisioning algorithms and Bayesian learning-to-rank models. If you are working on creative ranking or small-group experimentation, we would love to compare notes.
Appendix: model specification and references
We write 𝒩(μ, σ) parameterized by its standard deviation throughout. For arm a in campaign e, with standardized concept-embedding features xa (top 40 whitened principal components), centered label ya and known click noise σa:

We score a new batch of concepts with features fi and batch mean f̄ against the S = 4,000 saved draws β(s):

References
1. Ye, Yoganarasimhan and Zheng, LOLA: LLM-Assisted Online Learning Algorithm for Content Experiments. Across 17,681 Upworthy headline tests, prompting performed poorly and embedding-based models beat random only marginally at picking the best headline; pairing the best of them with a bandit improved clicks.
2. Jiang et al. (Meta), Improving Generative Ad Text on Facebook using Reinforcement Learning. A reward model with about 57% out-of-sample pairwise accuracy trained a generator that lifted advertiser click-through rate by 6.7%.
3. Chen et al. (Alibaba), Efficient Optimal Selection for Composited Advertising Creatives with Tree Structure. Thompson sampling over thousands of composited creatives with sparse feedback.